State of Technology #80

elsewhere

Architecture

Scalable JavaScript Design Patterns

Code

Peter Norvig on How to Code a Spelling Corrector

Design

Design Principles behind Firefox OS UX

Essay

Marissa Mayer, her leadership principles, and her Macs and Madonna Theory”

Mobile

Choice between native app and responsive website is not really a budgetary one

SaaS

Russian Novel Programming

Alexei Fyodorovich Karamazov is also called Alyosha, Alyoshka, Alyoshenka, Alyoshechka, Alexeichik, Lyosha, and Lyoshenka. Russian novel programming is the anti-pattern of one thing having many names. 

Service

Really crisp articulation of Lean Startup in about 30 super-light slides

Social

Slashdot turned 15 years – a tour of topics


Tool

Business Jargon Directory


Hack

Dentist Drill Plays Music


etc


parting thought

“Procrastination is finding the most difficult way of doing something, is jumping from one idea to another to another, is checking your emails.” – John Kelly
State of Data #120

Top Read


Big Data Cube – Volume, Velocity, Variety
(and associated paper)


Analysis


Statwing for Small Data Analysis


Big Data


Foursquare Data reveals where you live accurately 78% of time (paper)


Data Science


Detect Ballot Stuffing with Data


DBMS


Fully graphic Dashboard using SQL*Plus?!


Idea


Data Centers waste 90% or more energy they pull

“McKinsey & Company analyzed energy use by data centers and found that, on average, they were using only 6 percent to 12 percent of the electricity powering their servers to perform computations. The rest was essentially used to keep servers idling and ready in case of a surge in activity that could slow or crash their operations”


Learning

Simpson’s Paradox – or, how non-smokers could have higher mortality rates than smokers’?


Visualization


How to make XKCD style graphs in R?


etc


State of Data #119

Top Read


Demystifying Big Data: A Practical Guide To Transforming The Business of Government” – Report (pdf) is filled with some key insights –

  • While Big Data is transformative, the journey towards becoming Big Data “capable” will be iterative and cyclical, versus revolutionary
  • Big Data is often characterized by three factors: volume, velocity, and variety
  • Scalable analytics using software frameworks can be combined with storage designs that support massive growth for cost-effectiveness and reliability

Analysis

How ‘correlation does not imply causation’ became an almost irritating meme


Big Data

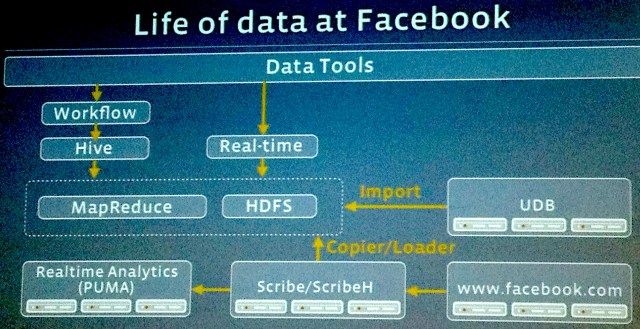
Life of Data at Facebook

Data Science

What do Real-life Hadoop workloads look like?


DBMS

Not sure if indexes will be used or how it will be used? You can always write such a small program to check for different execution paths


Idea

There are two types of data visuals– (a) Story Visualizations and (b) Answer Visualizations.

Learning

SQL Injection in 60 Seconds


Visualization

‘Information is Beautiful’ 2012 Award Winning Visualizations


etc